


Last year, AI helped you finish a sentence or write a function. Today, an agent can investigate a problem, work across several files and check its own changes. It also leaves a much larger bill.
That can feel like a broken promise. Wasn’t AI supposed to get cheaper?
Both things can happen at once: the cost of a comparable capability falls, while the amount and complexity of work you buy increase. To understand your bill, you need to separate the price of tokens, the tokens consumed by a task and the quality of the result.
TL;DR
- A cheaper token does not necessarily mean a cheaper completed task.
- Compare models on the same workload and at the quality level you actually need.
- Lower costs can make many more uses worthwhile, pushing total spending up.
- More spending is justified only when accepted results and business value increase with it.
What did the tenfold cost claim actually mean?
In his February 2025 essay Three Observations, Sam Altman described an approximately tenfold annual decline in the cost of using a given level of AI, alongside much greater use as prices fall.
The qualification matters. It compares the cost of a capability over time. It does not say that every new flagship model will have a lower token price, or that every company’s monthly invoice will shrink. Nor is an observed trend a guarantee for every task or future year.
Think of buying computing power: an older workload can become inexpensive while the most demanding new workload still costs a premium. Comparing yesterday’s everyday assistant with today’s most capable reasoning agent changes the thing being measured.
1. Token prices are only the starting point
Tokens are the chunks of text a model processes or generates. Providers can charge different rates for new input, cached input and output. The balance between these categories affects the bill.
The first chart shows how wide the pricing range is. In this snapshot, GPT-6 Astra and Claude Fable 5.1 list output at $50 per million tokens, while GLM-5.3 Flash lists $0.50. That hundredfold difference is a unit-price comparison; it says nothing by itself about equivalent results.
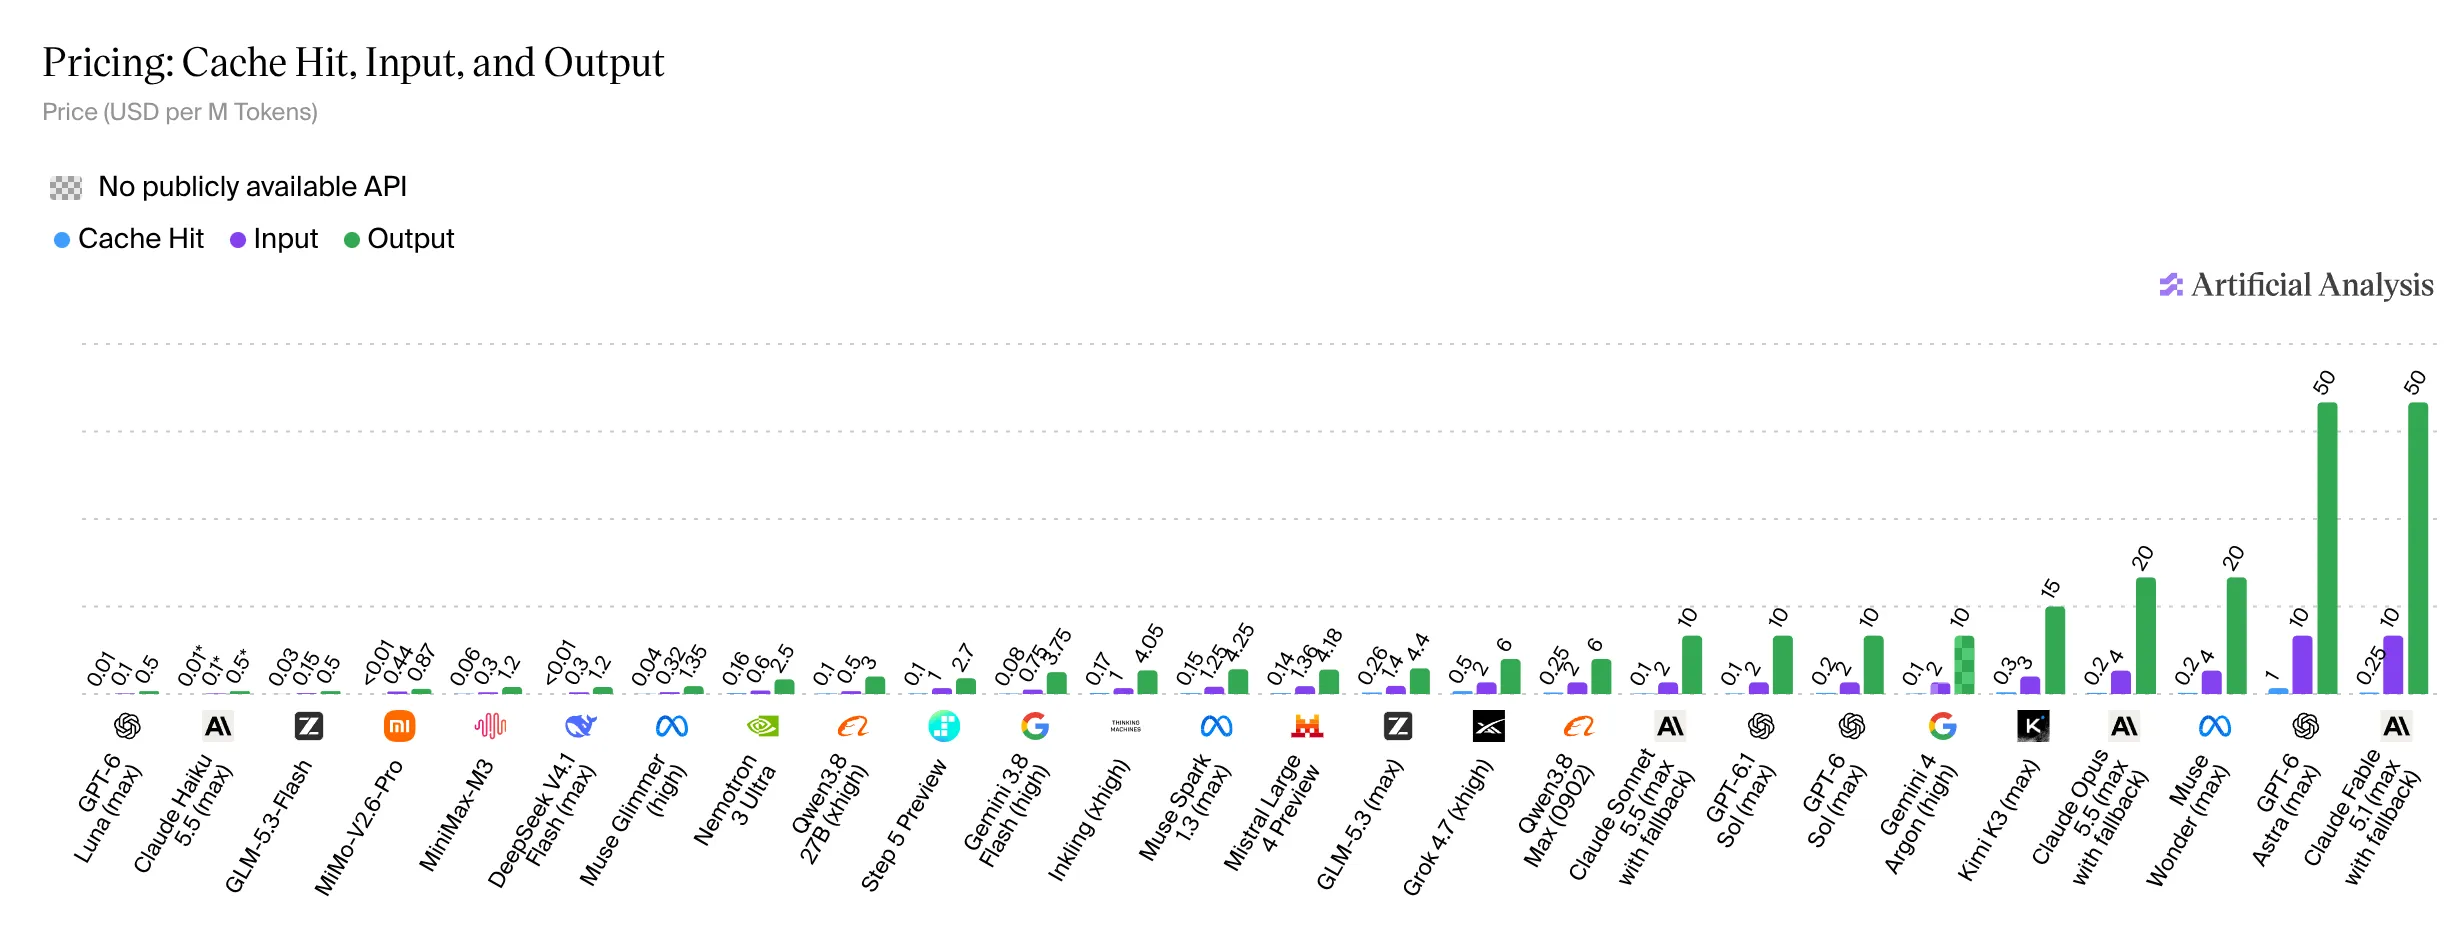
Source: Artificial Analysis — pricing. Original chart exported on 12 October 2026; prices in USD. Open the source chart to inspect the labels interactively.
For a workflow that reads large archives and produces short labels, input pricing may dominate. For a reasoning agent that repeatedly reads context, uses tools and generates long intermediate steps, output, cache behavior and the number of calls can matter much more. Compare all the billed categories for your actual workload.
2. Measure how much work a task consumes
A model with inexpensive output can still produce a lot of it. Another model may charge more per token but finish with fewer steps. Neither pattern guarantees a correct answer.
The second chart separates answer tokens from reasoning tokens. Those intermediate tokens count toward the work consumed, even when the final answer is short.
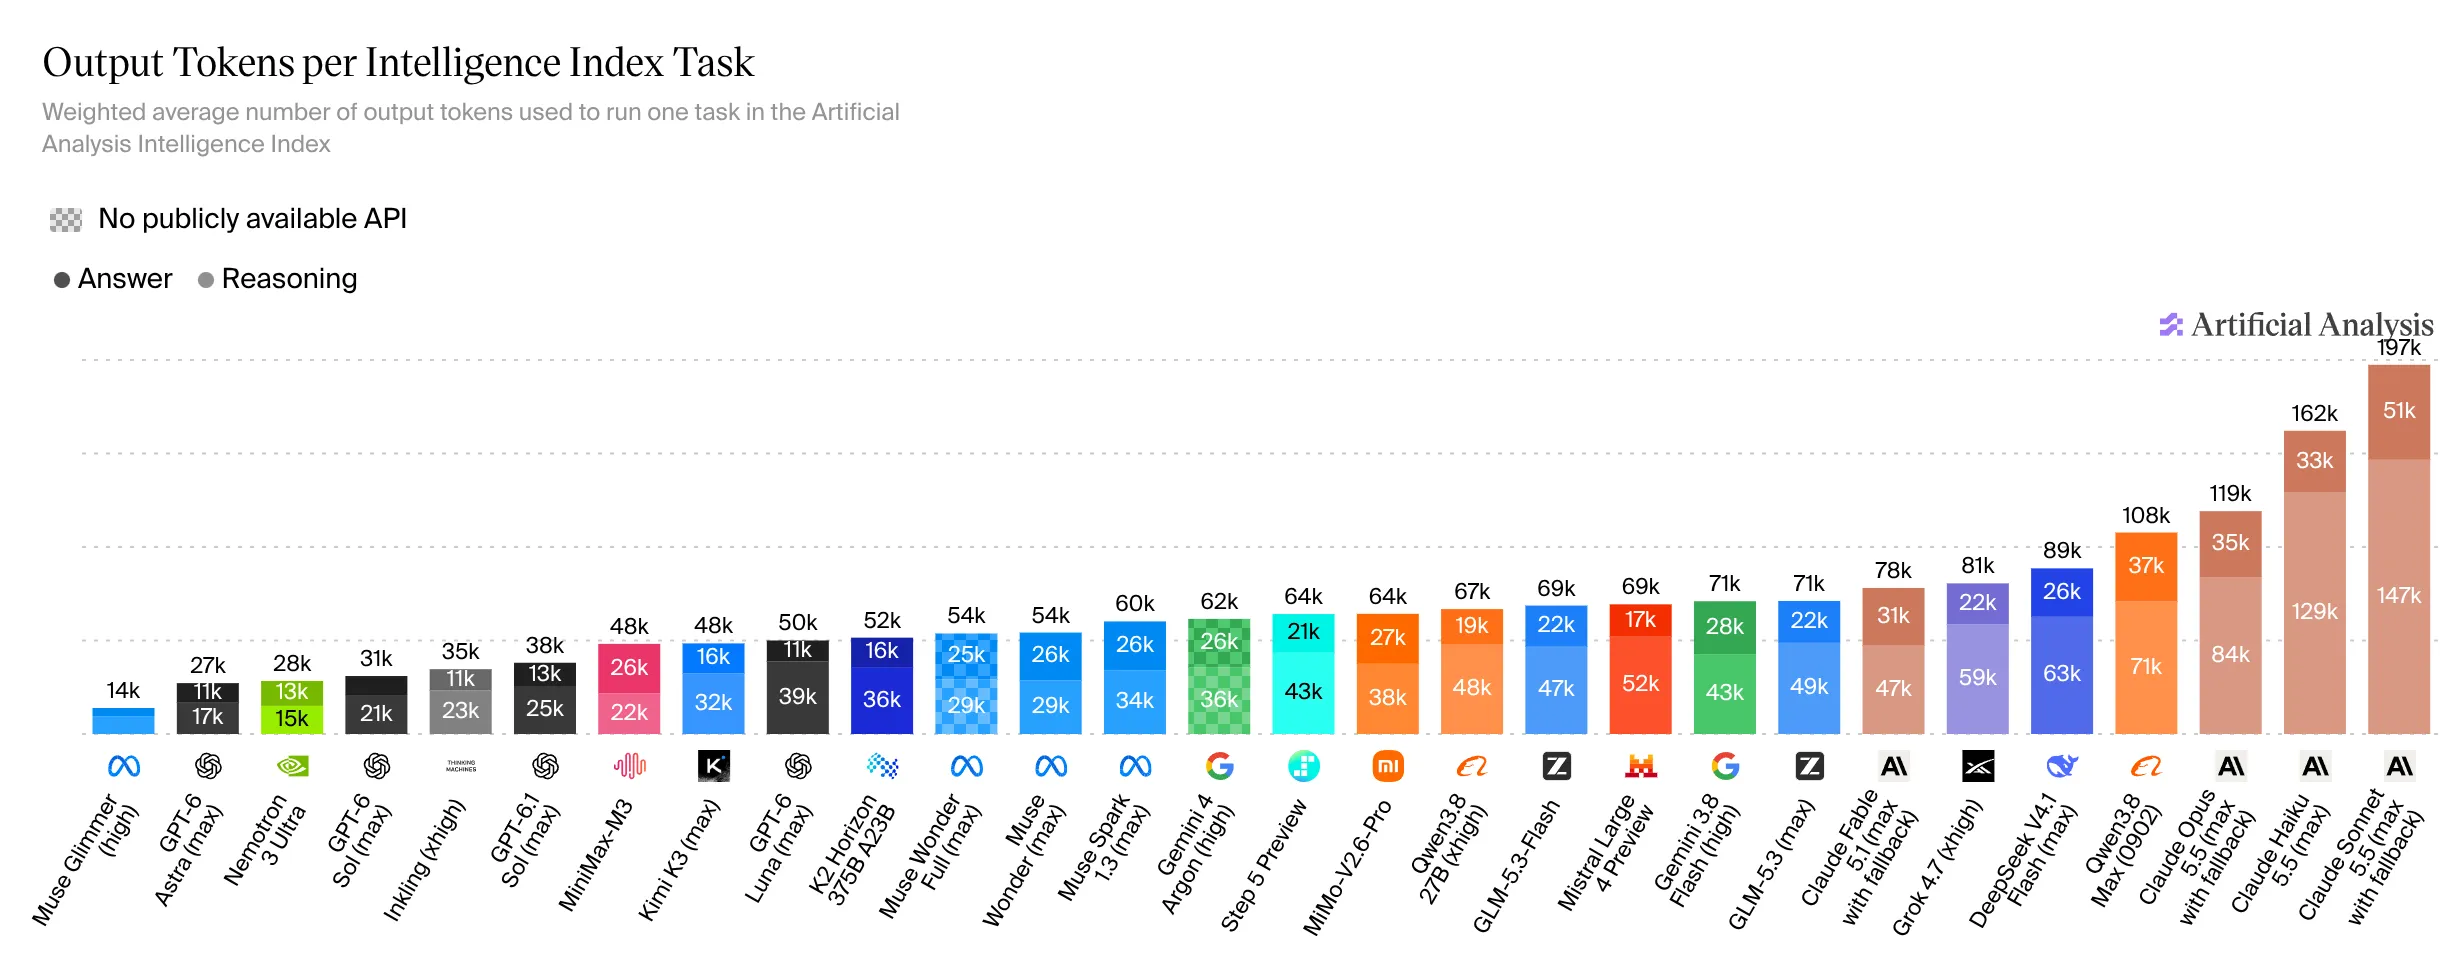
Source: Artificial Analysis — output tokens per task. Original chart exported on 12 October 2026. Bars show weighted averages across benchmark evaluations, not a prediction for an individual request.
For a deliberately simplified example, suppose one model charges $1 per million output tokens and uses 100,000 tokens for a task: $0.10. Another charges $5 but uses 10,000 tokens: $0.05. The higher token price produces the lower output charge. These are illustrative numbers; input, caching and tool costs are excluded.
In a company, go a step further: divide the complete workflow cost by the number of accepted results. Include failed attempts, retries, tool charges and human review. An inexpensive draft that needs substantial correction may cost more than a better first attempt.
3. Compare cost at the quality level you need
The next chart puts benchmark capability on the vertical axis and average benchmark task cost on the horizontal axis. Moving upward means a higher score; moving left means a lower cost. The horizontal scale is logarithmic, so equal distances represent ratios rather than equal dollar amounts.
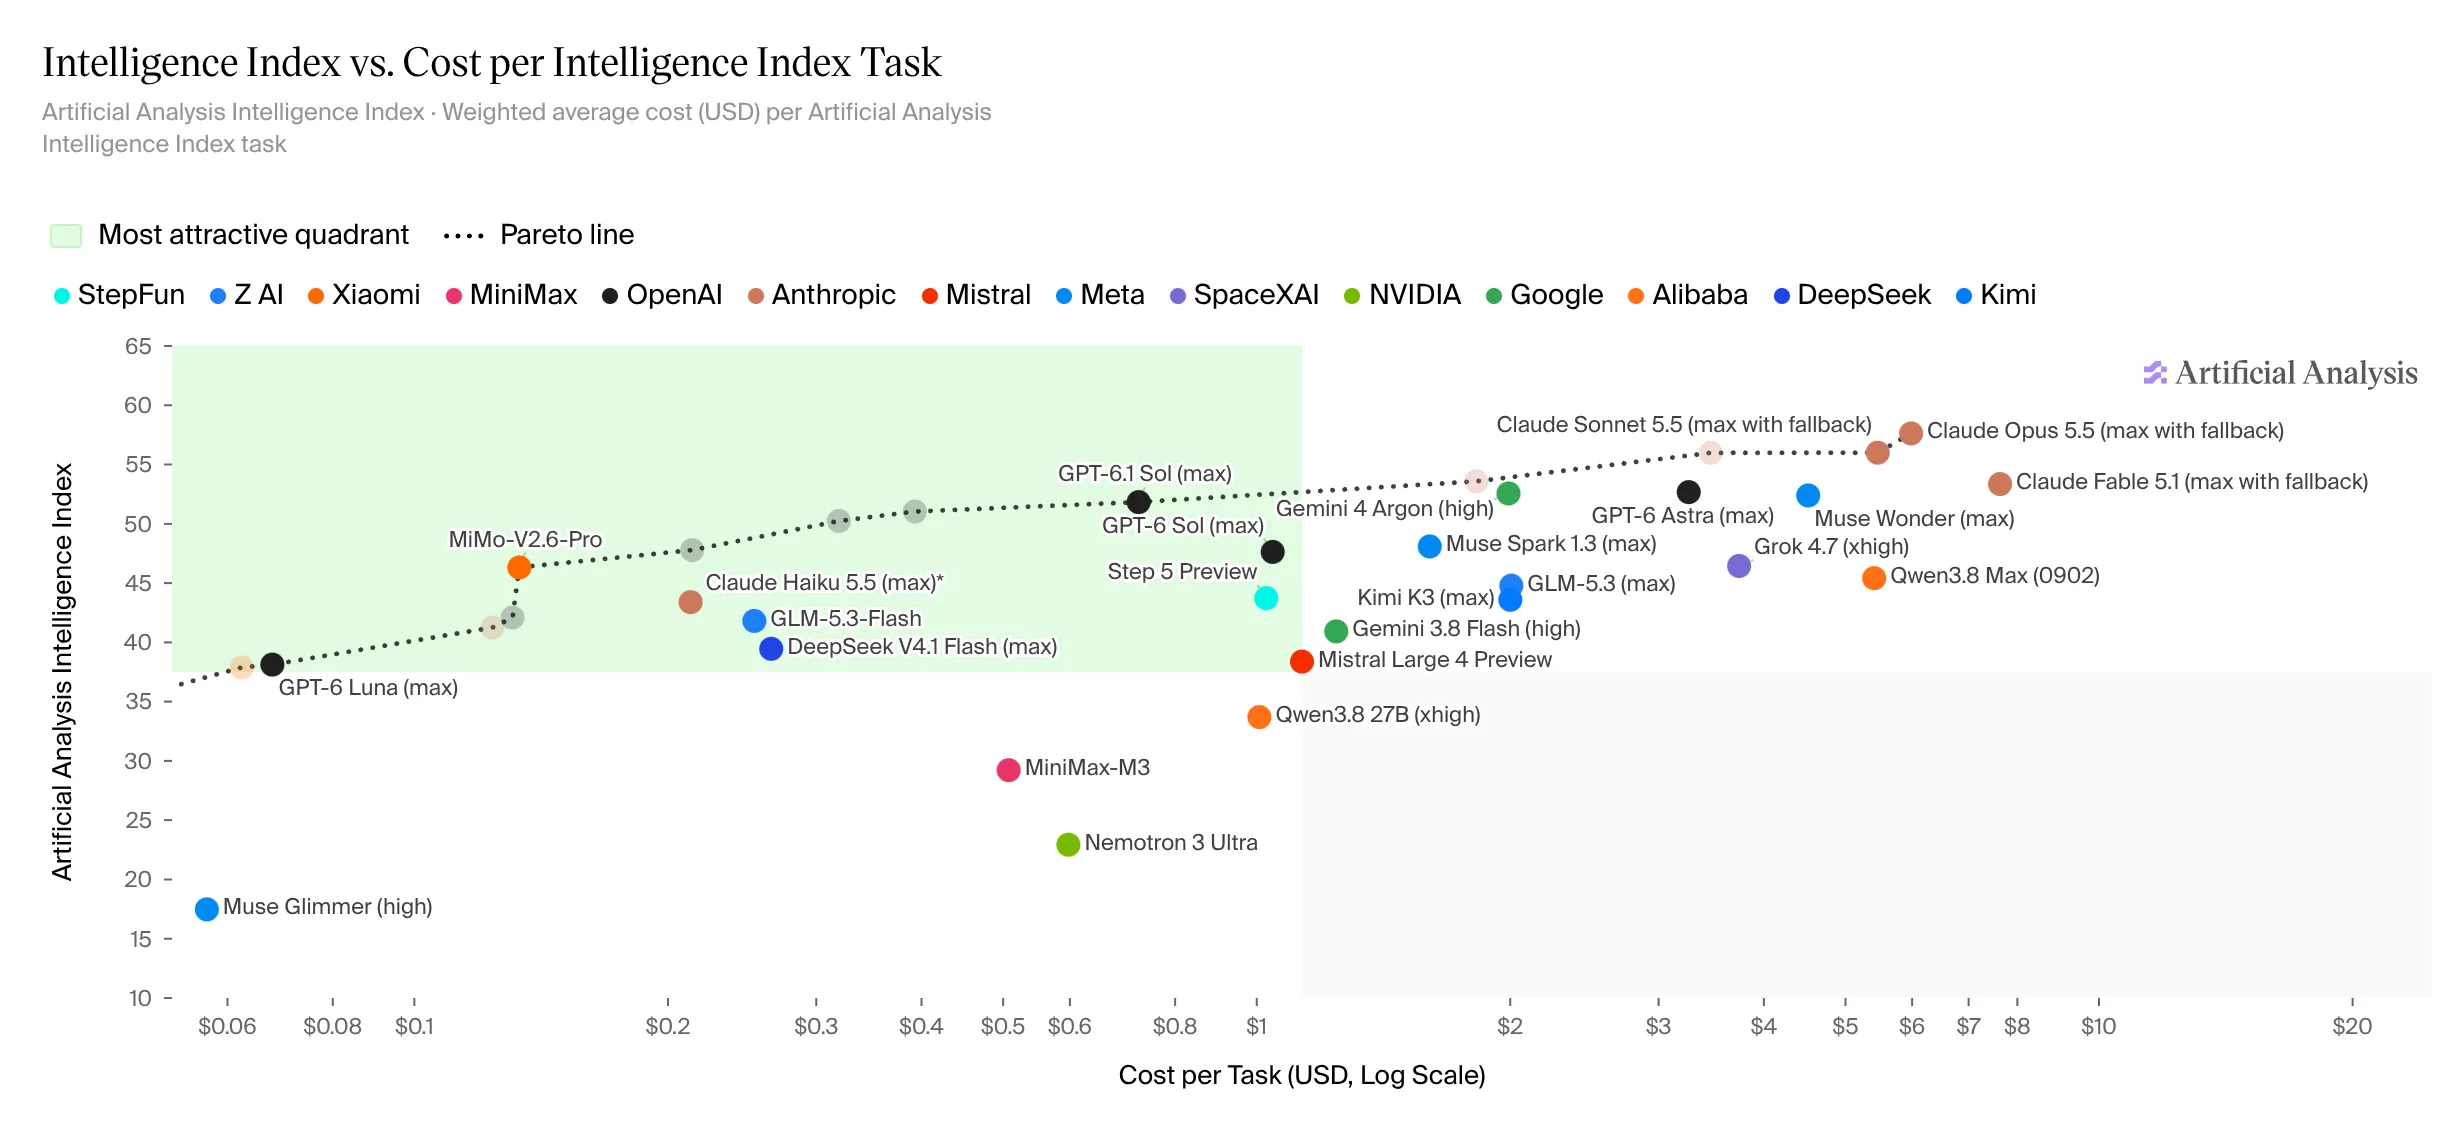
Source: Artificial Analysis — intelligence versus cost per task. Original chart exported on 12 October 2026. The dotted line marks the cost–capability Pareto frontier among the displayed model configurations.
The Pareto frontier identifies configurations where no other displayed option offers both at least as high a score and at most as low a cost, with an improvement in one of those dimensions. It helps narrow a shortlist. Your own task can still favor a model away from that line.
Artificial Analysis calculates its task-cost metric using input, cache-hit, cache-write, reasoning and answer charges, then weights evaluations according to the index. Its v4.3 announcement explains the calculation.
An index score is a benchmark summary. It is not a percentage of your business tasks completed correctly. The methodology also notes that the suite is primarily text-based and English-language. A German customer-service workflow, image-heavy document process or specialized technical task needs its own evaluation.
4. Hold capability steady and look over time
This is the comparison that gets closest to the original cost claim: how much does it cost to reach a fixed capability threshold as new options appear?
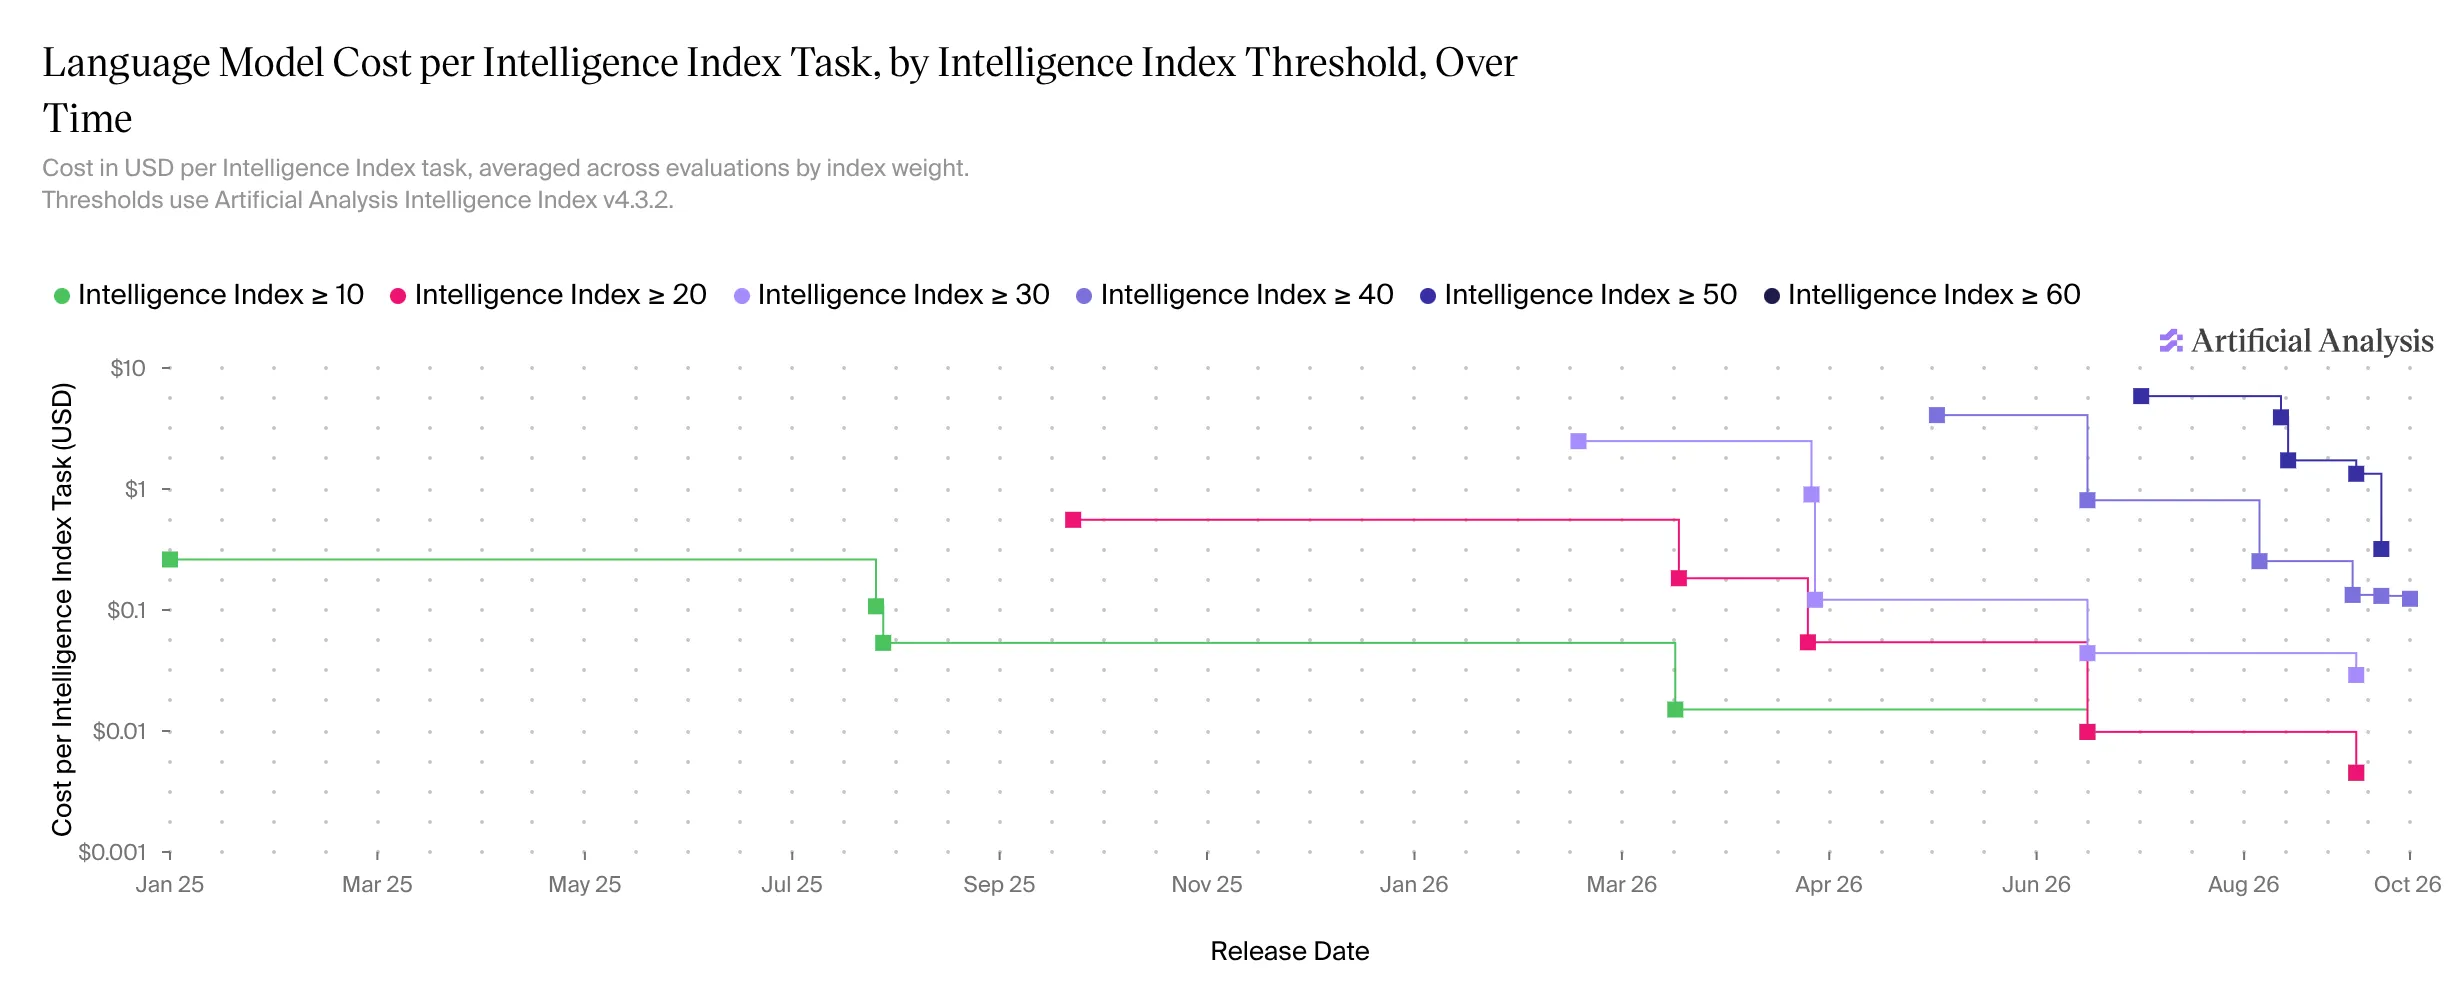
Source: Artificial Analysis — cost by capability threshold over time. Original chart exported on 12 October 2026, using Intelligence Index v4.3.2. The vertical cost axis is logarithmic.
Each color tracks an index threshold. The downward steps show cheaper ways of reaching that threshold as models become available. Higher thresholds enter later and can initially cost more.
This supports the central distinction: the cost of reaching an established capability can fall sharply even while a new capability commands a premium. It does not establish a universal tenfold saving on every workload. Benchmark versions also change; scores from different versions should not be treated as directly interchangeable.
The charts here are dated snapshots from the website, rather than a reconstruction of the video’s earlier selections. Their English labels are preserved from the original exports.
Why the total bill can still rise
For a comparable workload, a useful starting point is:
Total model spending = number of tasks × average model cost per task.
Suppose 200 tasks used to cost $1 each: $200. Later, the same kind of task costs $0.10, but your team runs 5,000 of them: $500. Unit cost fell by 90 percent; total spending grew by 150 percent. This is an arithmetic illustration, not a vendor price forecast.
Cheaper, more useful AI can make previously uneconomic work worth trying. A weekly summary becomes a daily summary. A few manually selected requests become every incoming request. A code suggestion becomes a longer investigation with tools and verification. This resembles the rebound effect often discussed as Jevons paradox: efficiency can encourage more consumption.
That is one explanation for a rising bill, not a diagnosis of every account. Higher tariffs, a switch to premium models, unnecessarily repeated context and agents stuck in loops can also increase costs. More tokens demonstrate consumption; they do not prove productivity.
What companies should track
Start with one repeatable process and a clear definition of an acceptable result. For example: an incoming request reaches the correct team, an answer draft cites the right internal information, or a software change passes its checks and review.
Track four measures together:
| Measure | What it helps you decide |
|---|---|
| Cost per accepted result | Is the workflow becoming more economical? |
| Acceptance and correction rates | Is lower cost coming at the expense of quality? |
| Staff time including review | Does the process actually save work? |
| Volume and total spending | Is useful adoption growing within the budget? |
Try smaller models for bounded work and stronger models for cases that need them. Reuse context where caching makes sense, avoid unnecessary calls and give agents explicit time, step and spending limits. Keep a human review path for uncertain cases. Treat model choice as something to evaluate periodically, using the same representative tasks.
This process perspective also guides our work with LIVOI: the useful result depends on information, tools and responsibilities around the model. Our article on Jev and structured decisions explores how a specialized model might handle one narrow step in such a workflow.
Common questions
Is AI actually getting cheaper?
The historical chart shows lower benchmark task costs at fixed capability thresholds. Whether your own process gets cheaper depends on its model, token use, quality requirements and review effort.
Should we always use the cheapest model?
Choose the least expensive workflow that reliably meets your requirements. That can involve a small model, a stronger model, ordinary software rules or a combination.
Is a higher AI bill a good sign?
It can reflect more useful work, but only accepted results and saved effort establish that. Compare the bill with outcomes, and investigate spending that grows without them.